以下部分引用 AI 总结,现阶段 AI 仍然有幻觉。请以内容的原文为准。
数据新鲜度群聊 07-14 ✓卖方 07-14 ✓Wrap 断档15天 ✕News 07-15 ✓X 断档12天 ✕页面生成 07-15
SOX
50 atoms · 跨 22 天 · 首见 2026-04-23 · 最近 2026-07-05
三色: 🟦 fact 44 · 🟥 take 6 · stance ▲10/▼5/◆7
叙事状态: ⚔️ contested (分歧) · ➡️ 平稳 · 策展近14d 2 atom · 🐦 X 近14d 9
状态只算低频策展源 (群/卖方); X firehose 仅作背景音量
来源: 群 2 · X 43 · 卖 5
时态: fresh:48 · stale:1 · aging:1
标签: 好数字:44 · 好观点:7 · 好思考:2 · 好信源:1
🟨 AI 综合 · junior analyst 概览
展开 AI 综合 (灰色 · 非市场结论 · 点击数字溯源到原 atom)
model: deepseek-chat · 2026-07-12 · 默认折叠
SOX 在 Q2 上涨了 88% [id=020ffd065275d71f],当前交易价格较 200 日均线高出 60%,这是自 2000 年 3 月以来最大的偏离度 [id=f4288e1c480d8131]。动量正在加速,RSI 已连续 4 周保持在 70 以上,接近 1999/2000 年牛市末段的 5.5 周纪录 [id=067c3f56abd99718];市场季节性也暗示涨势可能延续 [id=4ce2b89c3d33535e]。然而,该指数在 META 消息后两日内暴跌 11% [id=a3742a3fab291c53],近日更出现接近 -1400 点的剧烈波动 [id=d60afcafd2d60773],显示回调压力显著;有观点认为 SOX 需要休息 [id=5609f33165f6da46]。远期市盈率约 22 倍,略高于 5 年中位数 [id=22e4cbae97256f55],而指数市值已大到再涨 10 倍就会超过全球 GDP [id=981a68adf06e1376]。
🧭 拥挤度 (一人一票): ▲ 1 位作者 (KOL1) + 群 1 条 vs ▼ 2 位作者 (KOL2)
💢 核心分歧 (1 轴)
1. 动量极端 vs 均值回归风险
*topic: 动量指标/价格动态/技术指标/指数涨幅可持续性/指数涨幅 · 10 bull vs 3 bear*
🟢 bullish 侧:
- <a id="atom-067c3f56abd99718"></a>2026-05-08
群 [老旧] · 动量与 2000 年对比 · 动量指标/历史类比
SOX notable re: strength & momentum into the final sprint during the 1999/2000 bull run, the RSI peaked at 80 and stayed above 70 for precisely 5 1/2 weeks. Today, RSI has spent 4 weeks above 70, peaked at 85. Fwiw, 5 and 1/2 weeks in the red zone would end on NVDA earnings day.
tags: 好数字·好观点 · → daily
- <a id="atom-c2d899284f05fbe9"></a>2026-04-26
X·@KobeissiLetter · 历史连续上涨纪录 · 价格动态
the longest streak in history, overtaking the previous record of 15 days set in 2014
tags: 好数字 · → daily
value: qty=18天 · date=2026-04-26
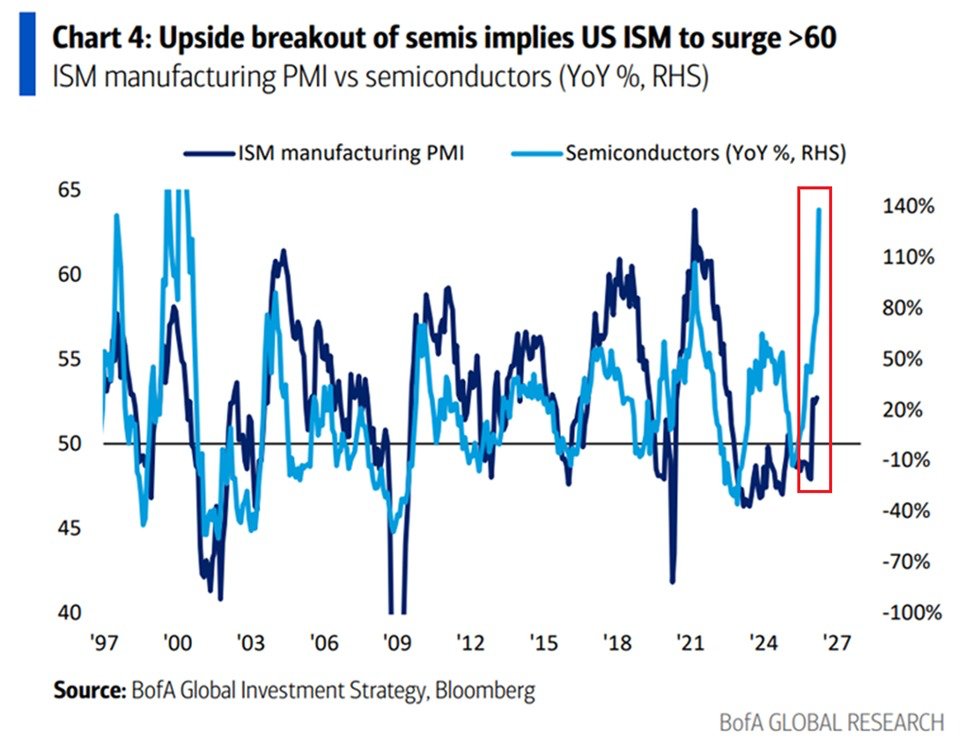
[图: 美国ISM制造业PMI与半导体行业同比变化率对比图 — 半导体行业同比增幅: ~140%; 预测ISM制造业PMI值: >60]
📷 原图
- <a id="atom-4ce2b89c3d33535e"></a>2026-05-07
X·@KobeissiLetter · 季节效应预测 · 价格动态
Market seasonality suggests the run in semiconductor stocks could continue.
tags: 好观点 · → daily
📷 原图
- <a id="atom-f4288e1c480d8131"></a>2026-05-11
X·@KobeissiLetter ⭐ · 相对200日均线偏离度 · 价格动态 +同日5条
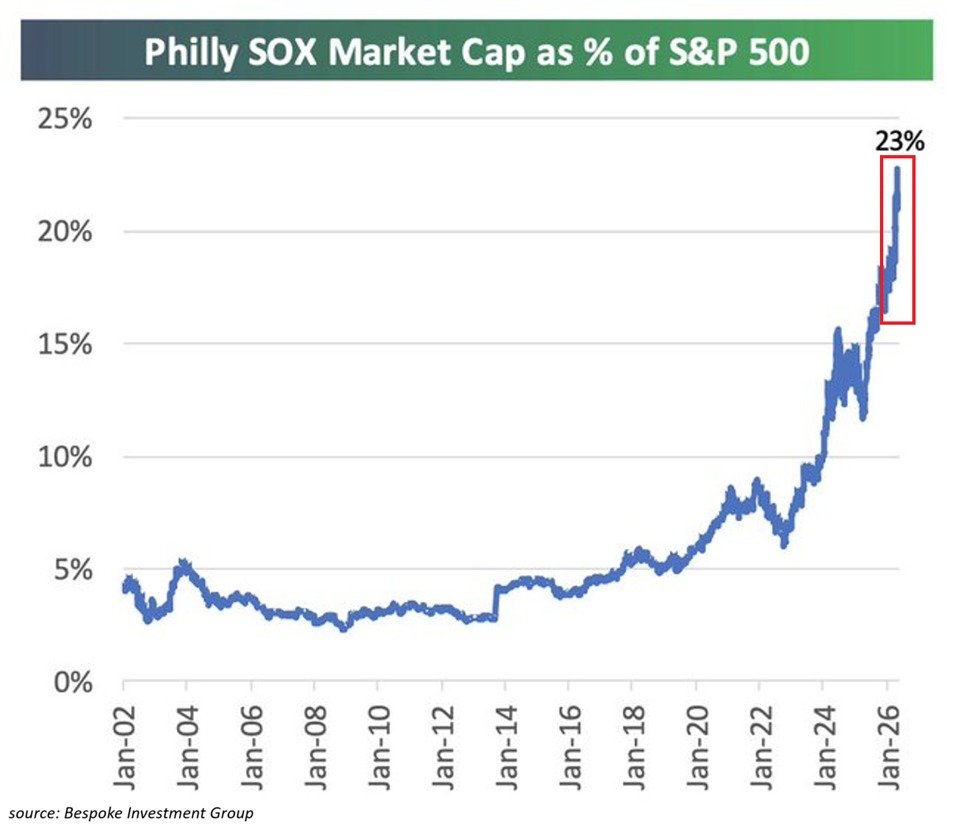
$SOX is now trading +60% above its 200-day moving average, the largest divergence since March 2000, when it was +110%.
tags: 好数字·好思考 · → daily
value: qty=+60% · date=2026-05-12
[图: 费城半导体指数(SOX)总市值占标普500指数总市值比例的历史走势图 — 23% (最新占比历史新高)]
📷 原图
- <a id="atom-eb9ecadf25db5d65"></a>2026-05-14
X·@KobeissiLetter · 同31日涨幅 · 价格动态
the semiconductor sector, $SOX, is up +68% over the same period, the 3rd-best 31-day performance on record.
tags: 好数字 · → daily
value: qty=+68% · date=2026-05-14
[图: 显示 SOXL、SOXS 和 TQQQ 杠杆 ETF 资金日流向的柱状图,突出显示 SOXL 创纪录的单日资金流入 — Direxion Daily Semiconductor Bull 3X ETF (SOXL) 资金流入: 1034.9883; Direxion Daily Semiconductor Bear 3X ETF (SOXS) 资金流
📷 原图
🔴 bearish 侧:
- <a id="atom-bf4a9a7d3ef14dce"></a>2026-06-05
X·@wallstengine · 单日跌幅 · 价格动态/仓位情绪
SEMICONDUCTOR INDEX POSTS ITS BIGGEST ONE-DAY DROP SINCE MARCH 2020
tags: 好数字 · → daily
value: qty=最大 · date=2026-06-05
📷 原图
- <a id="atom-5609f33165f6da46"></a>2026-06-06
X·@cnfinancewatch · 走势判断 · 仓位情绪/价格动态
SOX需要休息
tags: 好观点 · → daily
- <a id="atom-981a68adf06e1376"></a>2026-06-19
X·@TonyIsHere4You · 市值相对于全球GDP · 市值规模/指数涨幅可持续性
The semi index today already has such a large market cap that another 10x would make it bigger than the entire global GDP.
tags: 好观点 · → daily
value: direction=过大
展开 3 条中性
- <a id="atom-564bd25cc17efbe5"></a>2026-04-23
群 · 连续 17 天上涨创纪录,高出 200 DMA 达 43% · 指数走势/技术指标
SOX 指数连续 17 天上涨创纪录,高出 200 DMA 达 43%,为 2000 年 6 月以来最宽利差
tags: 好数字·好观点 · → daily
value: qty=连续17天,43%高于200DMA
- <a id="atom-4a53e8bed0b6c8c3"></a>2026-06-03
X·@cnfinancewatch · 指数变化率 · 价格动态
费城半导体指数(SOX)大涨5.9%至历史新高——2026年最大单日涨幅。
tags: 好数字 · → daily
value: qty=+5.9%
- <a id="atom-26b0e4688f6d160d"></a>2026-07-02
X·@labubu_trader · 价格水平 · 价格动态
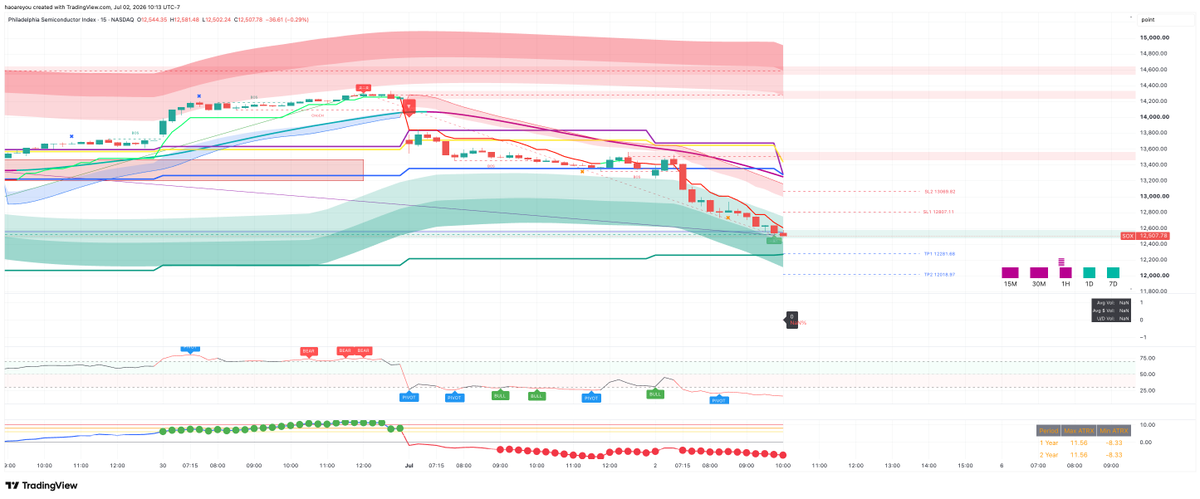
SOX can bottom at 50D EMA
tags: 好观点 · → daily
📷 原图
📏 估计带 (1)
*语料内对同一量的估计区间 (≥2 个估计才成带). 不判断谁对, 只陈列.*
- 估值倍数 2026: 15 – 22 · 2 个估计 · 最新 2026-06-08 15 (
卖·cred4)
🟦 客观事实 (facts) (30)
- <a id="atom-f4288e1c480d8131"></a>🟦 2026-05-11
X·@KobeissiLetter ⭐ · 相对200日均线偏离度 · 价格动态
$SOX is now trading +60% above its 200-day moving average, the largest divergence since March 2000, when it was +110%.
tags: 好数字·好思考 · → daily
value: qty=+60% · date=2026-05-12
[图: 费城半导体指数(SOX)总市值占标普500指数总市值比例的历史走势图 — 23% (最新占比历史新高)]
📷 原图
- <a id="atom-3b6e036a7ab82ce2"></a>🟦 2026-05-11
X·@KobeissiLetter ⭐ · 相对200日均线偏离度历史排名 · 价格动态
the largest divergence since March 2000, when it was +110%.
tags: 好数字·好思考 · → daily
value: date=2026-05-12
[图: 费城半导体指数(SOX)总市值占标普500指数总市值比例的历史走势图 — 23% (最新占比历史新高)]
📷 原图
- <a id="atom-564bd25cc17efbe5"></a>🟦 2026-04-23
群 · 连续 17 天上涨创纪录,高出 200 DMA 达 43% · 指数走势/技术指标
SOX 指数连续 17 天上涨创纪录,高出 200 DMA 达 43%,为 2000 年 6 月以来最宽利差
tags: 好数字·好观点 · → daily
value: qty=连续17天,43%高于200DMA
- <a id="atom-020ffd065275d71f"></a>🟦 2026-07-05
卖·Citi · Jon Zauderer · Q2涨幅 · 板块表现
半导体板块 SOX 在 Q2 上涨 88%
tags: 好数字 · → daily
value: qty=+88%
- <a id="atom-a3742a3fab291c53"></a>🟦 2026-07-05
卖·Citi · Jon Zauderer · META消息后两日跌幅 · 板块表现
META 消息后 SOX 两日内下跌 11%
tags: 好数字 · → daily
value: qty=-11%
- <a id="atom-d60afcafd2d60773"></a>🟦 2026-06-08
卖·MS Tom Wigg · 1D Change (Index Points)
SOX 1D Change (Index Points) shows extreme recent volatility, with a massive drop near -1400 points.
tags: 好数字 · → daily
value: qty=~-1400 · date=2026-06-08
- <a id="atom-22e4cbae97256f55"></a>🟦 2026-06-08
卖·MS Tom Wigg · 2Y Forward PE
SOX 2Y Forward PE is currently around 22x, slightly above its 5Y Median of ~21x.
tags: 好数字 · → daily
value: qty=22 · date=2026-06
- <a id="atom-f1896b7bceffb189"></a>🟦 2026-06-08
卖·MS Tom Wigg · 2Y Forward % PE Premium To SPX
SOX 2Y Forward % PE Premium To SPX is currently around 15%, in line with its 5Y Median.
tags: 好数字 · → daily
value: qty=15 · date=2026-06
- <a id="atom-5f1d7bdc5c21d4e6"></a>🟦 2026-06-30
X·@KobeissiLetter · 半年跑赢标普500幅度 · 业绩回顾
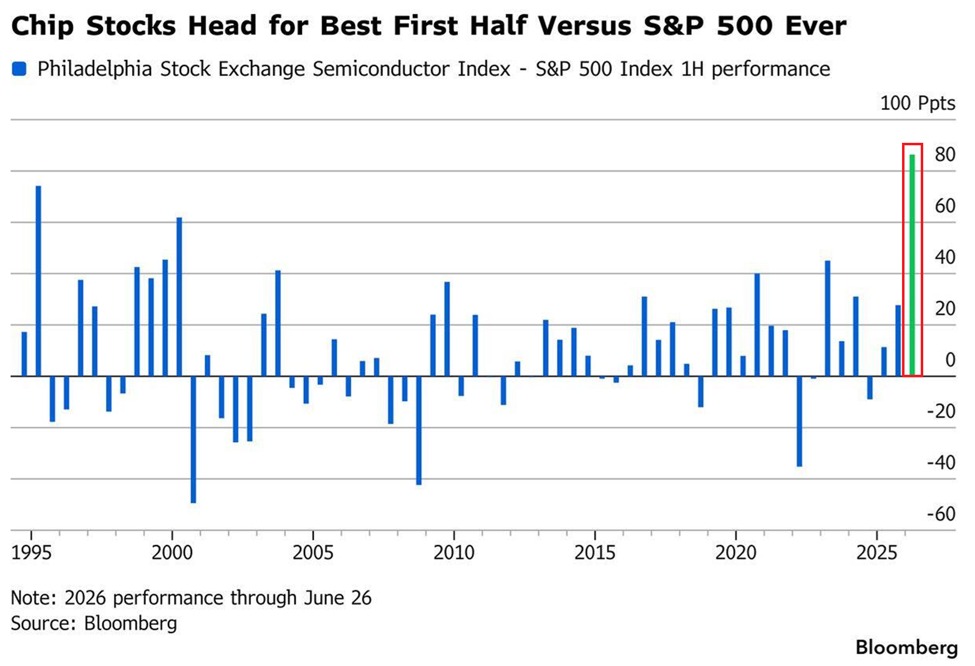
semiconductor index, $SOX, has outperformed the S&P 500 by +85 percentage points year-to-date, on pace for the best half-year outperformance in history
tags: 好数字 · → daily
value: qty=+85个百分点 · date=2026H1
📷 原图
- <a id="atom-2545bacb74405e85"></a>🟦 2026-06-30
X·@KobeissiLetter · 半年度跑赢幅度超过互联网泡沫纪录 · 业绩回顾
would exceed the previous record set during the Dot-Com Bubble in H1 2000 by +15 percentage points
tags: 好数字 · → daily
value: qty=+15个百分点 · date=2026H1
📷 原图
- <a id="atom-3d4b3b8f85e40330"></a>🟦 2026-06-30
X·@KobeissiLetter · 年内涨幅 · 业绩回顾
$SOX has rallied +94% so far in 2026, compared to a +9% increase in the S&P 500
tags: 好数字 · → daily
value: qty=+94% · date=2026
📷 原图
- <a id="atom-84afbabfa6f25f58"></a>🟦 2026-06-19
X·@KobeissiLetter · S&P 500市值占比 · 市场份额
Semiconductor stocks now account for a record 18.8% of the S&P 500’s market cap.
tags: 好数字 · → daily
value: qty=18.8% · date=2026-06-19
[图: 1995年至今半导体行业股票占标普500指数市值权重变化的历史走势图 — 当前占比: 18.8%; 起始年份: 1995年; 互联网泡沫时期高点: 约8%; 数据截止日期: 2026年6月15日]
📷 原图
- <a id="atom-3b91551d37f44f18"></a>🟦 2026-06-18
X·@KobeissiLetter · year-to-date performance · 股价表现
the semiconductor index, $SOX, is up +90% year-to-date
tags: 好数字 · → daily
value: qty=+90% · date=2026-06-18
[图: 半导体ETF(SMH和SOXX)周度资金流入历史趋势图,显示近期创纪录的资金流入飙升。 — 2026年6月12日当周流入额: 约4.5-4.7十亿美元]
📷 原图
- <a id="atom-4a2c799ddd86e840"></a>🟦 2026-06-05
X·@tuolaji2024 · 单日跌幅 · 价格动态
费半SOX-10%,2020年疫情以来最大单日跌幅!
tags: 好数字 · → daily
value: qty=-10% · date=2026-06-06
- <a id="atom-e5369ee81c4eb656"></a>🟦 2026-06-04
X·@KobeissiLetter · 同期涨幅 · 价格动态
$SOX has surged +84% while $NVDA has risen +24%
tags: 好数字 · → daily
value: qty=+84%
📷 原图
- <a id="atom-1b3d17a21d17326b"></a>🟦 2026-06-02
X·@KobeissiLetter · 涨幅 · 价格动态
the Semiconductor Index, $SOX, rising +66% over the same period
tags: 好数字 · → daily
value: qty=+66%
📷 原图
- <a id="atom-85e7022a0411e876"></a>🟦 2026-05-26
X·@zerohedge · 自近期低点以来涨幅 · 价格动态
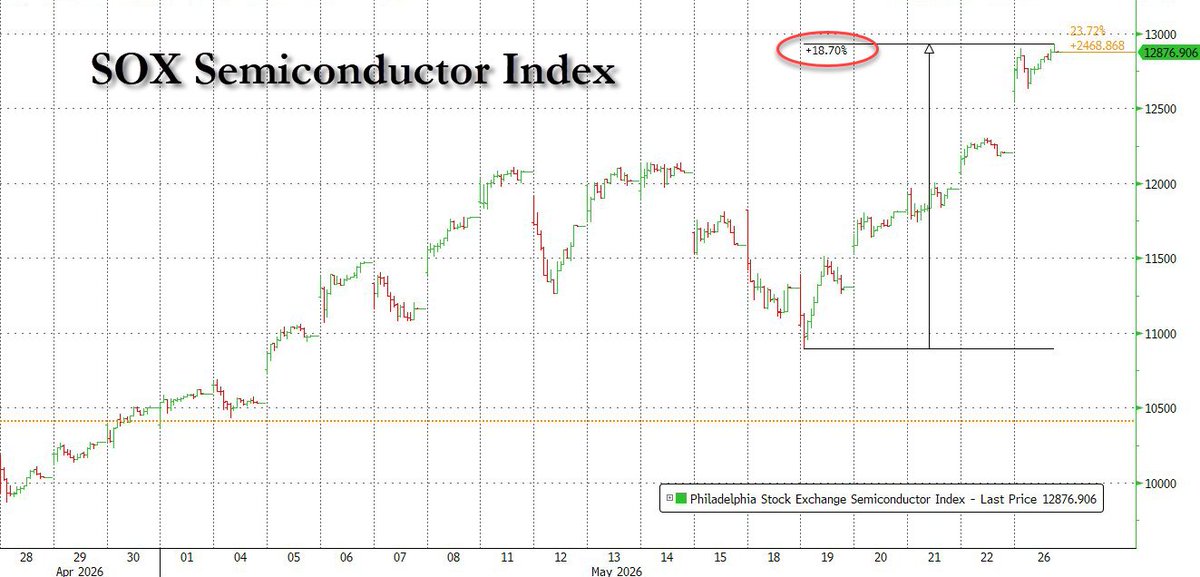
The SOX is up 18% since then. +18.70%
tags: 好数字 · → daily
value: qty=18.70% · direction=up
[图: 费城半导体指数 (SOX) 走势图,显示自近期低点以来的反弹幅度 — +18.70% (自低点以来的涨幅); 12876.906 (最新价格); +2468.868 (上涨点数)]
📷 原图
- <a id="atom-eb9ecadf25db5d65"></a>🟦 2026-05-14
X·@KobeissiLetter · 同31日涨幅 · 价格动态
the semiconductor sector, $SOX, is up +68% over the same period, the 3rd-best 31-day performance on record.
tags: 好数字 · → daily
value: qty=+68% · date=2026-05-14
[图: 显示 SOXL、SOXS 和 TQQQ 杠杆 ETF 资金日流向的柱状图,突出显示 SOXL 创纪录的单日资金流入 — Direxion Daily Semiconductor Bull 3X ETF (SOXL) 资金流入: 1034.9883; Direxion Daily Semiconductor Bear 3X ETF (SOXS) 资金流
📷 原图
- <a id="atom-67efedf5cf2a6f97"></a>🟦 2026-05-11
X·@KobeissiLetter · S&P 500 市值占比 · 市值占比
Semiconductor Index, $SOX, now accounts for a record 23% of the S&P 500's market cap.
tags: 好数字 · → daily
value: qty=23% · date=2026-05-12
[图: 费城半导体指数(SOX)总市值占标普500指数总市值比例的历史走势图 — 23% (最新占比历史新高)]
📷 原图
- <a id="atom-2b9c43bf8e3d38dc"></a>🟦 2026-05-11
X·@KobeissiLetter · 市值占比相对2年前变化 · 市值占比
This percentage has DOUBLED over the last 2 years.
tags: 好数字 · → daily
value: direction=up · delta=+100%
[图: 费城半导体指数(SOX)总市值占标普500指数总市值比例的历史走势图 — 23% (最新占比历史新高)]
📷 原图
- <a id="atom-c9f5508feb2c27a5"></a>🟦 2026-05-11
X·@KobeissiLetter · 涨幅期间 · 指数涨幅
the index has rallied +146% over this period, outperforming the S&P 500's gain of +43%.
tags: 好数字 · → daily
value: qty=+146% · period=2年
[图: 费城半导体指数(SOX)总市值占标普500指数总市值比例的历史走势图 — 23% (最新占比历史新高)]
📷 原图
- <a id="atom-b374bc5b1ebfa509"></a>🟦 2026-05-11
X·@KobeissiLetter · 相对S&P 500超额收益 · 指数涨幅
outperforming the S&P 500's gain of +43%.
tags: 好数字 · → daily
value: qty=+103% · period=2年
[图: 费城半导体指数(SOX)总市值占标普500指数总市值比例的历史走势图 — 23% (最新占比历史新高)]
📷 原图
- <a id="atom-67f951311de5305a"></a>🟦 2026-05-11
X·@KobeissiLetter · 近期交易上涨天数比例 · 指数涨幅
The index has also finished positive in 24 of the last 28 trading days, surging +65% over this period.
tags: 好数字 · → daily
value: qty=24/28天 · date=2026-05-12
[图: 费城半导体指数(SOX)总市值占标普500指数总市值比例的历史走势图 — 23% (最新占比历史新高)]
📷 原图
- <a id="atom-8cfbb85c61d615ab"></a>🟦 2026-05-07
X·@KobeissiLetter · 22日回报 · 价格动态
BREAKING: The Semiconductor Index, $SOX, is now up +45% over the last month, the strongest 22-day return since 2002, and the 3rd strongest since data began in 1994.
tags: 好数字 · → daily
value: qty=+45% · date=过去一个月
📷 原图
- <a id="atom-fe03017e197a1571"></a>🟦 2026-05-07
X·@KobeissiLetter · 月度涨幅 · 价格动态
In April alone, the index rallied +40%, its best monthly performance in 26 years, and the 2nd-best on record.
tags: 好数字 · → daily
value: qty=+40% · date=2026年4月
📷 原图
- <a id="atom-9349ed58942db44d"></a>🟦 2026-05-07
X·@KobeissiLetter · 市值占标普500比例 · 价格动态
As a result, $SOX's market cap as a % of the S&P 500 is up to an all-time high of 22%.
tags: 好数字 · → daily
value: qty=22% · date=当前
📷 原图
- <a id="atom-a0859899f111d4ff"></a>🟦 2026-05-07
X·@KobeissiLetter · 市值占比自2022年低点变化 · 价格动态
This percentage has nearly QUADRUPLED since the 2022 bear market low.
tags: 好数字 · → daily
value: direction=近翻四倍 · date=自2022年低点至今
📷 原图
- <a id="atom-b21a1c4b2da7abe7"></a>🟦 2026-05-07
X·@KobeissiLetter · 5月历史平均回报 · 价格动态
Meanwhile, the $SOX index has returned an average of +2.2% in May over the last 30 years, its 4th best month of the year.
tags: 好数字 · → daily
value: qty=+2.2% · date=过去30年5月
📷 原图
- <a id="atom-b260ed74afa32641"></a>🟦 2026-04-26
X·@KobeissiLetter · 同比涨幅 · 价格动态
The semiconductor sector, $SOX, has rallied +150% YoY
tags: 好数字 · → daily
value: qty=+150% · date=2026-04-26
[图: 美国ISM制造业PMI与半导体行业同比变化率对比图 — 半导体行业同比增幅: ~140%; 预测ISM制造业PMI值: >60]
📷 原图
- <a id="atom-48ea43801221d5ab"></a>🟦 2026-04-26
X·@KobeissiLetter · 连续收盘上涨天数 · 价格动态
$SOX has now closed higher for 18 consecutive trading sessions
tags: 好数字 · → daily
value: qty=18 · date=2026-04-26
[图: 美国ISM制造业PMI与半导体行业同比变化率对比图 — 半导体行业同比增幅: ~140%; 预测ISM制造业PMI值: >60]
📷 原图
🟥 多头 takes (bullish) (3)
- <a id="atom-067c3f56abd99718"></a>🟥 2026-05-08
群 [老旧] · 动量与 2000 年对比 · 动量指标/历史类比
SOX notable re: strength & momentum into the final sprint during the 1999/2000 bull run, the RSI peaked at 80 and stayed above 70 for precisely 5 1/2 weeks. Today, RSI has spent 4 weeks above 70, peaked at 85. Fwiw, 5 and 1/2 weeks in the red zone would end on NVDA earnings day.
tags: 好数字·好观点 · → daily
- <a id="atom-082af0ca704ac37a"></a>🟥 2026-05-11
X·@KobeissiLetter [老化中] · 动量特征 · 价格动态
Momentum in chip stocks is accelerating.
tags: 好观点 · → daily
[图: 费城半导体指数(SOX)总市值占标普500指数总市值比例的历史走势图 — 23% (最新占比历史新高)]
📷 原图
- <a id="atom-4ce2b89c3d33535e"></a>🟥 2026-05-07
X·@KobeissiLetter · 季节效应预测 · 价格动态
Market seasonality suggests the run in semiconductor stocks could continue.
tags: 好观点 · → daily
📷 原图
🟥 空头 takes (bearish) (2)
- <a id="atom-981a68adf06e1376"></a>🟥 2026-06-19
X·@TonyIsHere4You · 市值相对于全球GDP · 市值规模/指数涨幅可持续性
The semi index today already has such a large market cap that another 10x would make it bigger than the entire global GDP.
tags: 好观点 · → daily
value: direction=过大
- <a id="atom-5609f33165f6da46"></a>🟥 2026-06-06
X·@cnfinancewatch · 走势判断 · 仓位情绪/价格动态
SOX需要休息
tags: 好观点 · → daily
🟥 中性 takes (neutral) (1)
🟦 新闻流 (squawk · 1)
展开新闻流 (FirstSquawk / financialjuice / wallstengine / DeItaone — 快讯, 非原创 take)
- <a id="atom-bf4a9a7d3ef14dce"></a>🟦 2026-06-05
X·@wallstengine · 单日跌幅 · 价格动态/仓位情绪
SEMICONDUCTOR INDEX POSTS ITS BIGGEST ONE-DAY DROP SINCE MARCH 2020
tags: 好数字 · → daily
value: qty=最大 · date=2026-06-05
📷 原图
⏱ 时间轴 (近 20)
- 🟦 2026-07-05 ·
fact · Q2涨幅 · → daily
- 🟦 2026-07-05 ·
fact · META消息后两日跌幅 · → daily
- 🟥 2026-07-02 ·
forecast · 价格水平 · → daily
- 🟦 2026-07-02 ·
fact · 指数类型 · → daily
- 🟦 2026-06-30 ·
fact · 点位 · → daily
- 🟦 2026-06-30 ·
fact · 累计涨幅 · → daily
- 🟦 2026-06-30 ·
fact · 复合增长率 · → daily
- 🟦 2026-06-30 ·
fact · 近3月涨幅 · → daily
- 🟦 2026-06-30 ·
fact · 半年跑赢标普500幅度 · → daily
- 🟦 2026-06-30 ·
fact · 半年度跑赢幅度超过互联网泡沫纪录 · → daily
- 🟦 2026-06-30 ·
fact · 年内涨幅 · → daily
- 🟦 2026-06-21 ·
fact · 6%超の上昇 · → daily
- 🟦 2026-06-19 ·
fact · S&P 500市值占比 · → daily
- 🟥 2026-06-19 ·
narrative · 市值相对于全球GDP · → daily
- 🟦 2026-06-18 ·
fact · year-to-date performance · → daily
- 🟦 2026-06-08 ·
fact · 1D Change (Index Points) · → daily
- 🟦 2026-06-08 ·
fact · 2Y Forward PE · → daily
- 🟦 2026-06-08 ·
fact · 2Y Forward % PE Premium To SPX · → daily
- 🟥 2026-06-06 ·
forecast · 走势判断 · → daily
- 🟦 2026-06-05 ·
fact · 单日跌幅 · → daily
← 实体目录 · 系统日志